
Quantification of branched PFAS is a subject of interest within the larger field of PFAS testing, driven, in part, because linear and branched PFAS isomers can differ in bioactivity and distribution. Both forms are pervasive in the environment because electrochemical fluorination, a production method utilized by early manufacturers, generates a mixture of linear and branched PFAS [1]. Accurate analysis of branched PFAS is critical because the branched isomers can have notably different biological uptake rates and toxicity compared to their linear analogues [2]. Identification and quantification of the exact isomeric ratio of branched and linear PFAS is also important because it can be used forensically to identify the source of PFAS contamination [3].
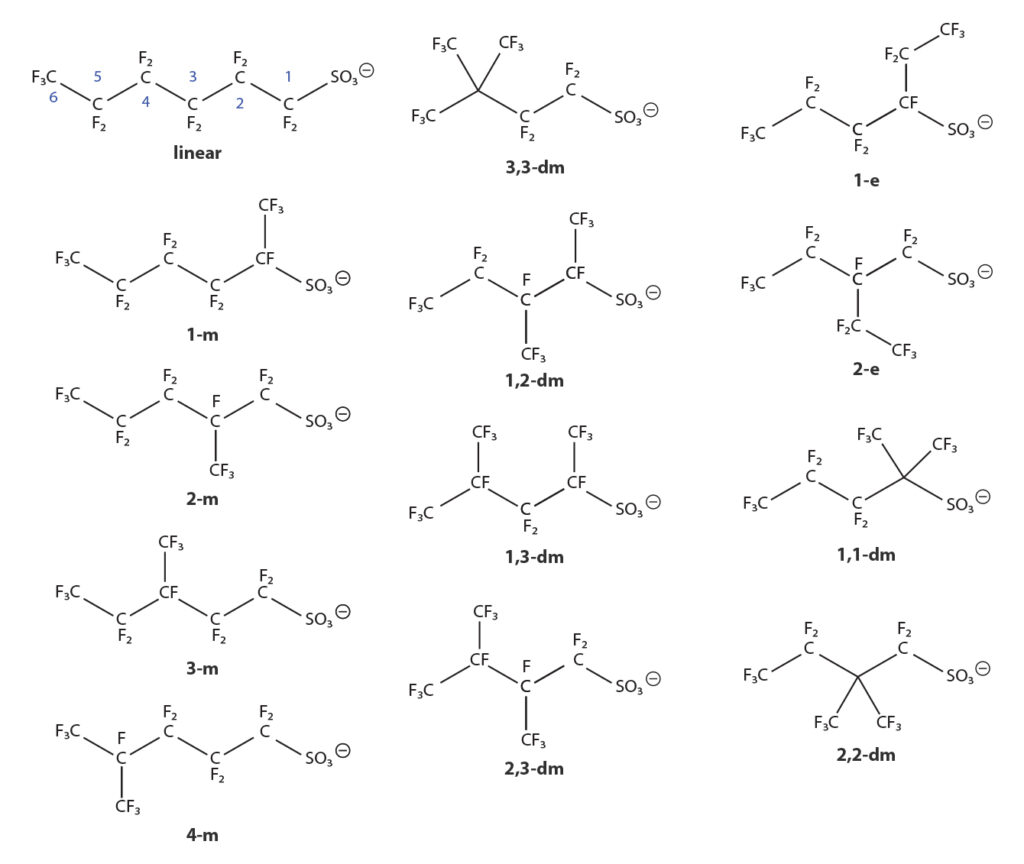
Herein, three different techniques (LC-MS, LC-MS/MS, and 19F-NMR) were compared for the determination of the percentage of branched isomers in two sources of PFHxS. Figure 1 outlines the nomenclature for the PFHxS isomers detailed in this study.
Quantification of Branched PFAS by LC-MS/MS and LC-MS
For an initial test, two sources of PFHxS were analyzed by both LC-MS and LC-MS/MS under the conditions described in Table I. For LC-MS analysis, samples were diluted to a final concentration of 45 µg/mL in methanol. For LC-MS/MS analysis, samples were diluted to a final concentration of 200 ng/mL, 2 ng/mL, and 0.2 ng/mL. Samples were prepared and run in triplicate unless otherwise noted.
In all cases, the sum of the areas of the branched PFAS isomers was compared to the combined total area for the analyte. % Branching is expressed as 100 x (area sum of branched isomers)/(area sum of all isomers).
Table I: Chromatographic Conditions for Determining % Branched PFAS
| LC-MS | LC-MS/MS | |
|---|---|---|
| LC | Shimadzu LC-20ADXR | Waters ACQUITY Premier |
| Detector | Shimadzu LCMS-2020 | Waters Xevo TQ Absolute |
| Column | Ultra C18 (cat.# 9174312) PFAS delay column (cat.# 27854) | Force C18 (cat.# 9634252) PFAS delay column (cat.# 27854) |
| Dimensions | 100 x 2.1 mm ID Delay: 50 x 2.1 mm | 50 x 2.1 mm ID Delay: 50 x 2.1 mm |
| Particle Size | 3 µm Delay: 5 µm | 1.8 µm Delay: 5 µm |
| Mobile Phase A | 0.5 mM ammonium acetate in water | 0.5 mM ammonium acetate in water |
| Mobile Phase B | Methanol | Methanol |
| Gradient | Initial 80% A, decrease to 10% A by 10 min, hold at 10% A until 12 min | Initial 80% A, decrease to 5% A by 6 min, hold at 5% A until 8.5 min, change to 80% A, then hold at 80% A until 9.5 min |
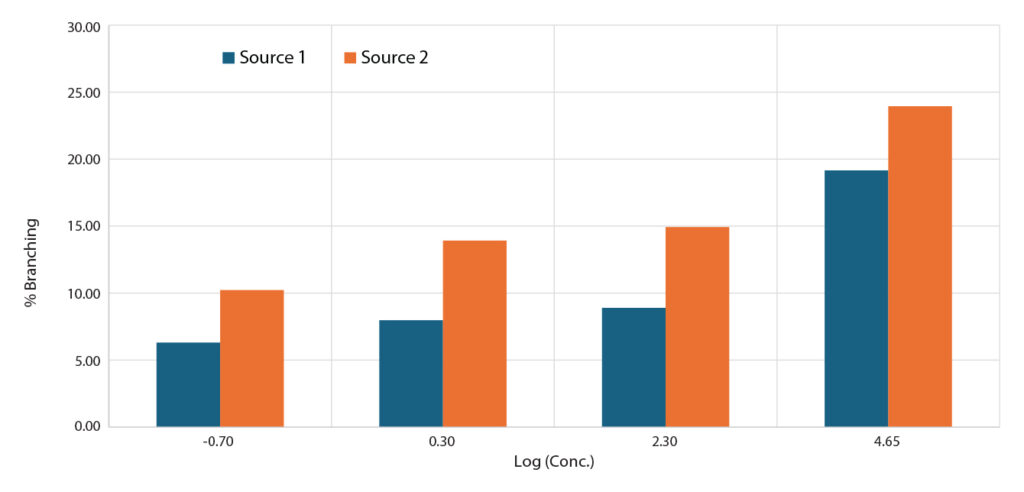
As shown in Table II and Figure 2, the effect of concentration was quite pronounced; even within the same method and material, values of % branched PFAS could vary by almost as much as 40%! (10.23% to 14.93%) There was an even more noticeable jump between different analytical methods with the LC-MS method calculating a much greater amount of branched PFAS compared to the results obtained by LC-MS/MS. Clearly, this warranted further investigation.
Table II: % Branched PFAS Determined by LC-MS/MS and LC-MS as a Function of Measured Concentration
| Source 1 | Source 2 | |||||||
|---|---|---|---|---|---|---|---|---|
| Conc. (ng/mL) | Log (Conc.) | Method | Linear (Area) | Branched (Area) | %Branched | Linear (Area) | Branched (Area) | %Branched |
| 0.2 | -0.70 | LC-MS/MS | 6220.477 | 418.9723 | 6.31 | 5719.01 | 651.755 | 10.23 |
| 2 | 0.30 | LC-MS/MS | 315781.6 | 27369.7 | 7.98 | 273846.9 | 44281.95 | 13.92 |
| 200 | 2.30 | LC-MS/MS | 23859299 | 2330513 | 8.90 | 21574895 | 3787125 | 14.93 |
| 45,000 | 4.65 | LC-MS | 17623610 | 4177266 | 19.16 | 17825243 | 5613984 | 23.95 |
To delve further into the impact of concentration, the LC-MS/MS method was used to analyze a sample of source 2 that was diluted across a much wider concentration range (0.009 ng/mL to 1480 ng/mL) than was previously tested using this technique. Results are shown in Table III and Figure 3.
Table III: Extended Linear Range Testing of PFHxS by LC-MS/MS
| Concentration (ng/mL) | Linear (Area) | Branched (Area) | % Branched |
|---|---|---|---|
| 0.009 | 276.907 | 48.384 | 14.87407 |
| 0.074 | 1795.388 | 351.731 | 16.38153 |
| 0.092 | 1980.368 | 370.349 | 15.75473 |
| 0.185 | 3933.348 | 716.919 | 15.41673 |
| 0.277 | 6897.543 | 1369.095 | 16.56169 |
| 0.74 | 17551.12 | 3478.774 | 16.54204 |
| 2.775 | 59034.63 | 12011.85 | 16.90704 |
| 7.4 | 156885.8 | 31021.65 | 16.50901 |
| 148 | 382294 | 78220.66 | 16.98549 |
| 296 | 744305.6 | 154995.1 | 17.23507 |
| 740 | 1592732 | 391488.9 | 19.7301 |
| 1480 | 2569690 | 835119 | 24.52763 |
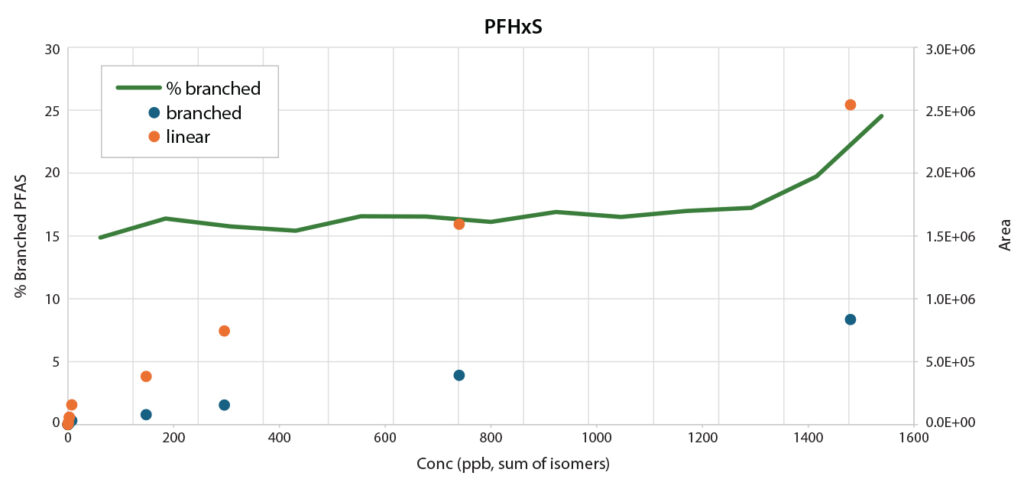
There’s a notable increase in the calculated % branched PFHxS at the high end of the concentration range. This is consistent with detector saturation of the more abundant linear isomer before the branched isomers. Presumably, as the slope of the linear isomer’s response begins to plateau, the amount of branched isomers continues to increase. Ultimately this results in higher calculated % branched PFAS.
On the other extreme, there’s a slight decrease in the % branched PFAS at the low end of the concentration range. This decrease is likely due to loss of signal of the less abundant branched isomers prior to the loss of signal for the linear isomer. For PFHxS, sensitivity is high enough that this decrease in signal is not outside of the linear range for this study. However, for a compound with slightly less sensitivity, such as PFOS, this low-level effect becomes much more prominent (Figure 4).
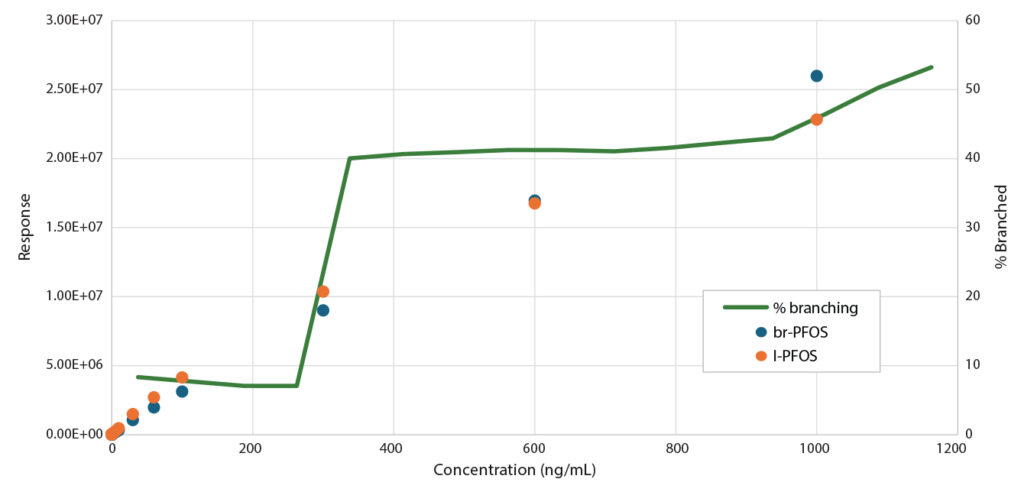
Clearly, there’s an appropriate linear range in which % branched PFAS can be determined chromatographically. The exact linear range is dependent on multiple factors, including chromatographic resolution, instrument sensitivity, and % branching within the sample. Without discrete standards for each isomer, direct comparison across different analytical systems is almost impossible.
That poses a real concern for testing certificated reference materials. If a manufacturer determines % branched PFAS in a reference material chromatographically, the end user might determine a significantly different result based on differing conditions. To resolve some of those issues, we can explore another method of quantification: nuclear magnetic resonance (NMR).
Quantification of Branched PFAS by 19FNMR
NMR measures individual moieties within a molecule rather than separating compounds based on retention to a stationary phase. It requires the presence of a nonzero spin nuclei (typical 1H or 13C) with an observable magnetic moment. 19F is a highly abundant spin-active nuclei (l=1/2), which is a valuable tool for the analysis of these highly fluorinated molecules.
19FNMR provides several unique benefits compared to chromatography:
- Structure assignments can be determined by either unique chemical shifts or longer range (J4) coupling constants.
- Quantification is relatively straight forward. Integrations are proportional to the number of fluorine atoms within a moiety rather than on the response factor of the analyte as a whole, and as such, quantification does not require isolation of each isomer.
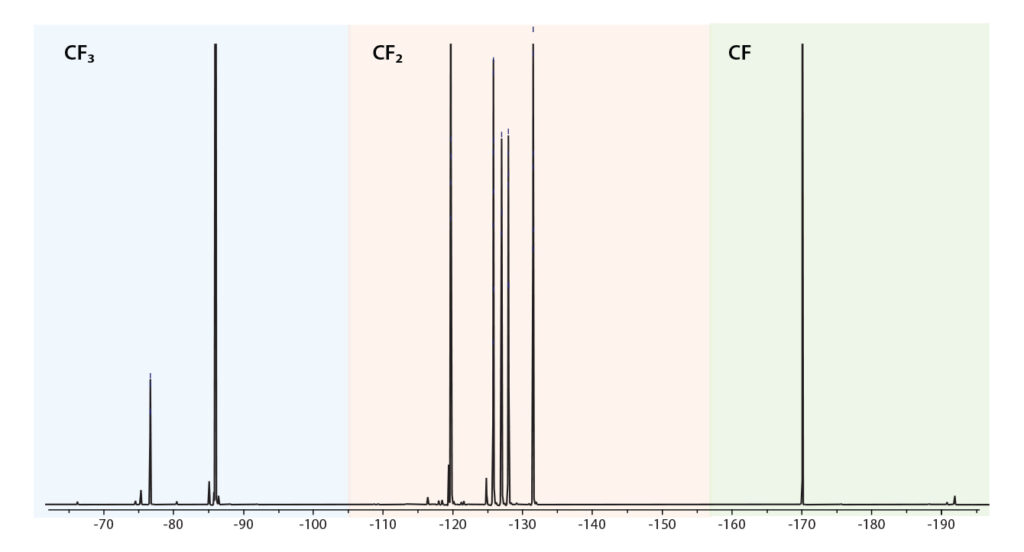
19FNMR has one chief benefit compared to more typical HNMR—its large chemical window. Let’s look at our example molecule, PFHxS. Here, as shown in Figure 5, the spectra can be divided into three large domains depending on the number of fluorine atoms directly attached to the geminal carbon. CF3 groups tend to appear around -60 to -100 ppm, CF2 groups appear around -110 to -140 ppm, and CF groups appear after -170 ppm.
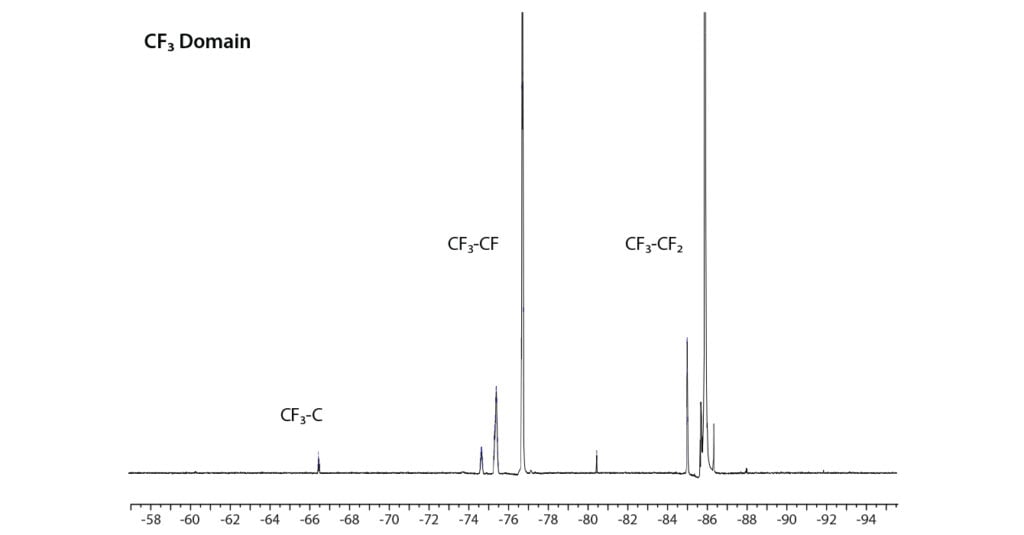
Furthermore, we can subdivide each of these domains based on the functionality within the vicinal carbon. For example, within the CF3 domain we can observe a different chemical shift for CF3 groups with vicinal CF2, CF, or C groups (Figure 6). A similar shift can be observed for both CF2 and CF moieties. In general, more fluorine atoms on the vicinal carbon results in a more upfield shift.
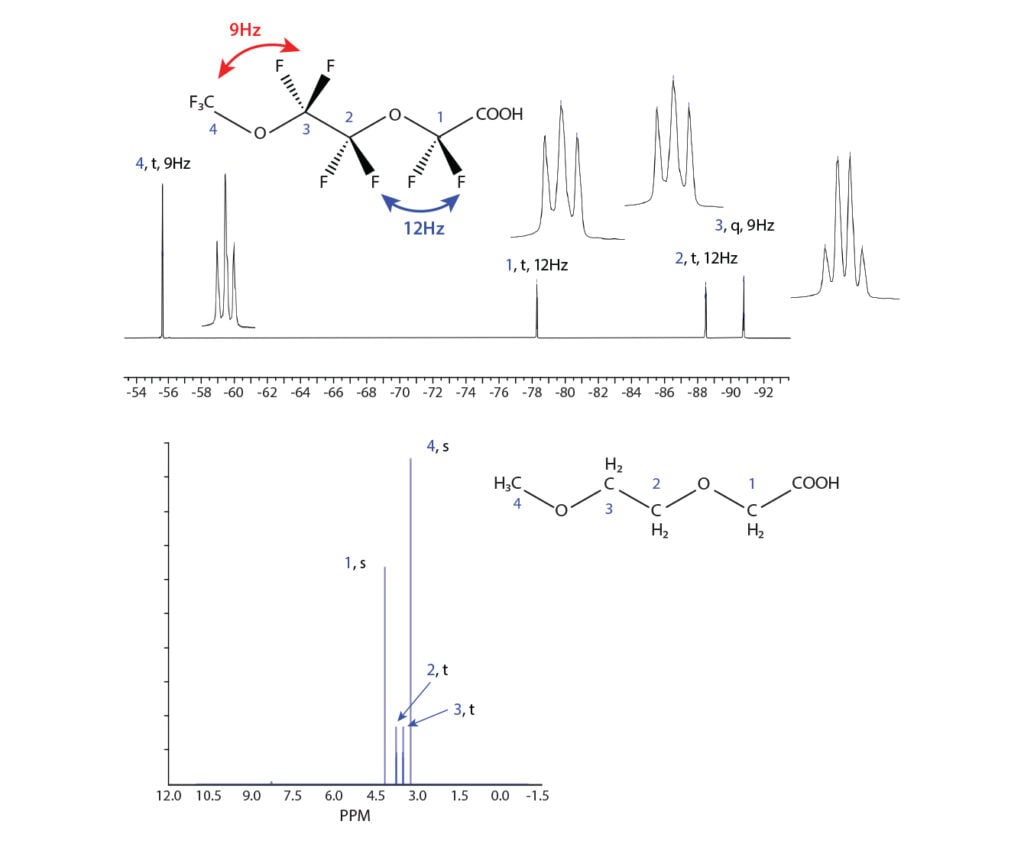
Next, we can utilize coupling to further help identify each isomer. Perfluoroalkyl groups are interesting in the fact that coupling between fluorine atoms appears predominately to take place through space [4]. As such, the typical J2 coupling that would be expected in HNMR is much smaller (<2 Hz) than a J4 coupling—a revelation that prior to my understanding, led to many a confusing structural assignment.
A prime example of the oddities of this domination of through-space coupling is the molecule, NFDHA (nonafluoro-3,6-dioxaheptanoic acid, CAS: 151772-58-6), compared to its non-fluorinated analogue, (2-methoxyethoxy)acetic acid, CAS: 16024-56-9). Both fluorinated ends couple to remote CF2 groups through an ether moiety, whereas the adjacent CF2 groups do not couple to each other (Figure 7). Ultimately, coupling in NFDHA results in three triplets and one quartet. Conversely, (2-methoxyethoxy)acetic acid is predicted to exhibit a pair of singlets and a pair of triplets with only the two adjacent methylene moieties coupling together.
Back to a more relevant example for our current subject matter of isomeric assignment: let’s consider the isomers 3,3-dm, and 3-m (Figure 8).

Starting with 3,3-dm, the defining feature of the molecule is the perfluoro-tert-butyl moiety. With its distinctive tertiary carbon center, we would expect a single peak corresponding to a total of nine fluorine atoms fairly far downfield within the CF3 domain. Indeed, in Figure 9, we can observe a pseudo pentet around -66 ppm with a rather large coupling constant of 13.6 Hz.
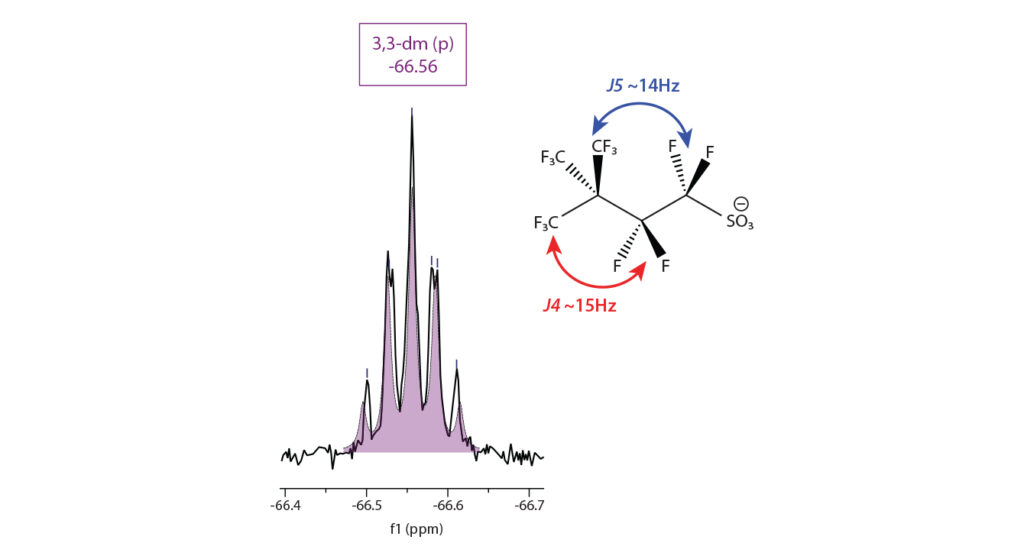
Eagle-eyed observers might also note a slight splitting of each peak within the pseudo pentet. I would hypothesize the observed peak is an overlay of two similar signals—one for the CF3 group anti to the CF2 group adjacent to the end group, and another for the two CF3 groups syn to the CF2 group adjacent to the end group. At the temperature at which the spectrum was acquired (25 °C), rotation about the C-C bond is sufficiently restricted such that we observe two distinct but very similar peaks. Variable temperature NMR was outside of the scope of this work, but it would be interesting to observe if coalescence would be reached given a sufficiently high temperature.
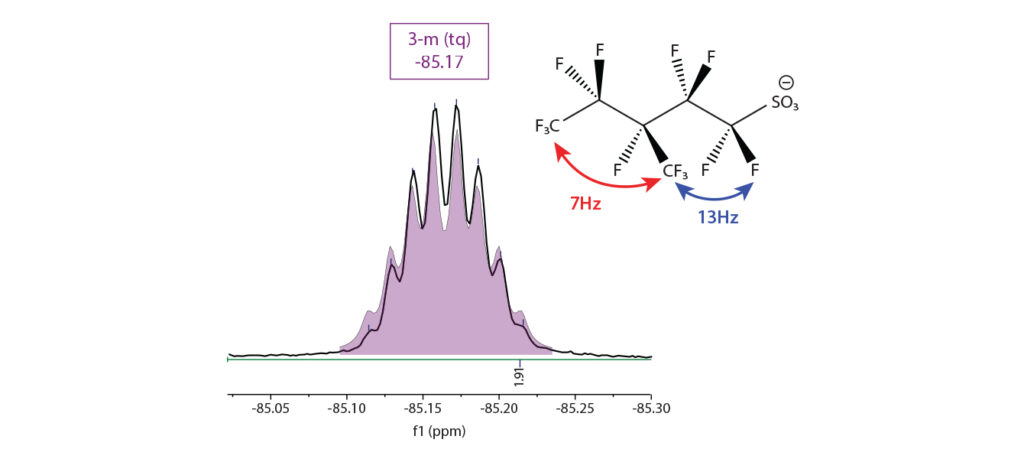
Next, let’s look at 3-m. The CF3 group on the 3-position is vicinal to a CF moiety. We can observe a triplet-quartet at around -85 ppm with coupling constants 7 and 13 Hz (Figure 10).
It should be noted that 19FNMR has some shortfalls for isomeric assignments. Assignment based on long-range coupling requires well-resolved peaks. For very structurally similar compounds, overlapping signals can make unambiguous assignment impossible. For example, as shown in Figure 11, we observe a complicated overlay of two multiplets around -75.5 ppm.
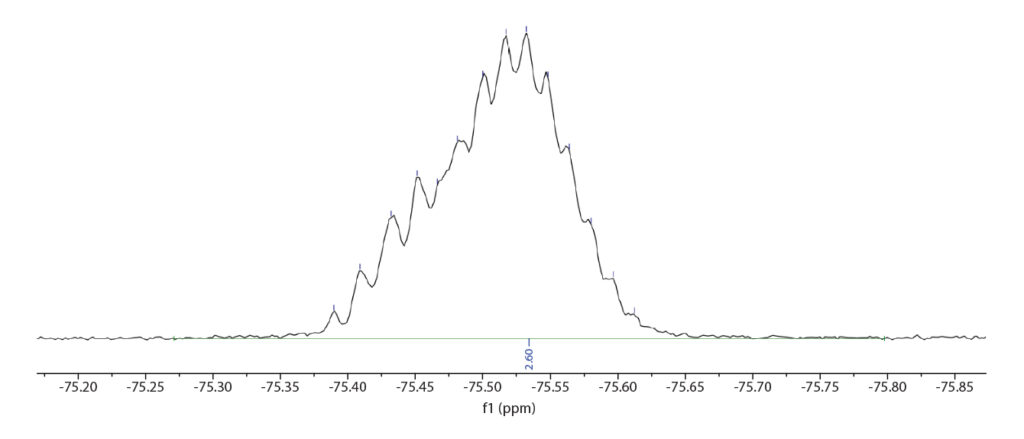
In such a case, we can’t definitely identify which isomers correspond to the observed peaks without having a reference material for comparison. Still, based on the chemical shift data, we can assign these to a CF3 group adjacent to a CF group. We can assign the number of fluorine atoms as equal to three and integrate the sum of both as an unknown isomer.
Once we’ve made assignments to the best of our abilities, we can quantify each isomer. To do so, the typical procedure is as follows:
- Integrate one unique moiety per isomer.
- Set the total integration to a fixed number (e.g., 100).
- Divide each peak area by its number of fluorine atoms (e.g., a peak corresponding to a CF3 group is divided by three).
- Determine the percentage of each isomer based on these normalized areas.
Table IV shows a typical isomeric breakdown.
Table IV: Relative Percentage of PFHxS Isomers in Source 1
| PFHxS | Area | #F | Normalized Area | % Total |
|---|---|---|---|---|
| linear | 81.57 | 3 | 27.19 | 86.73 |
| 1-m | 0.1100 | 1 | 0.1100 | 0.3508 |
| 2-m | 0.3500 | 2 | 0.1750 | 0.5582 |
| 3-m | 1.910 | 3 | 0.6366 | 2.030 |
| 4-m | 11.95 | 6 | 1.991 | 6.353 |
| 3,3-dm | 0.1800 | 9 | 0.02000 | 0.06380 |
| Unknown 1 | 2.600 | 3 | 0.8666 | 2.764 |
| Unknown 2 | 0.7200 | 2 | 0.3600 | 1.148 |
The isomeric breakdown for each source measured by 19FNMR is compared in Table V.
Table V: Comparison of PFHxS Isomers by Source
| Source 1 | Source 2* | |
|---|---|---|
| Isomer | % Total | % Total |
| linear | 86.7 | 81.1 |
| 1-m | 0.4 | 2.9 |
| 2-m | 0.6 | 1.4 |
| 3-m | 2 | 5 |
| 4-m | 6.4 | 8.9 |
| 3,3-dm | 0.1 | 0.2 |
| Unknown | 3.9 | 0.5 |
| * Information from vendor | ||
Summary
Finally, we can compare our measured % branched PFHxS results across all three techniques (Table VI). In general, LC-MS/MS underreports % branched PFAS, likely due to unresolved separation of isomers from the linear molecule. The larger discrepancy between the LC-MS/MS and NMR data for Source 1 than for Source 2 might suggest that the unknown isomers noted in 19FNMR are likely coeluting with the linear isomer. Data from LC-MS was generally higher for both sources, likely due to detector oversaturation of the linear isomer.
Table VI: Comparison of % Branched PFHxS by Technique
| Source 1 | Source 2 | |
|---|---|---|
| LC-MS | 20.50 | 21.86 |
| LC-MS/MS | 8.90 | 14.93 |
| 19FNMR | 13.30 | 18.90 |
Care should be taken when applying % branching data derived from NMR directly to chromatographic analysis because NMR can often resolve linear and branched compounds that are likely to coelute chromatographically. Using values for % branched PFAS determined by NMR directly will likely result in overreporting of % branched PFAS. When analyzing new lots of PFAS material by LC-MS/MS, it’s recommended that % branched PFAS and an appropriate linear range be determined empirically under the exact chromatographic conditions to be used for analysis.
References
The science of organic fluorochemistry. 3M Co. Document.1999. https://www.ag.state.mn.us/Office/Cases/3M/docs/PTX/PTX1558.pdf
K. Schulz, M. Silva, R. Klaper, Distribution and effects of branched versus linear isomers of PFOA, PFOS, and PFHxS: A review of recent literature, Sci. Total Environ., 733 (2020) https://doi.org/10.1016/j.scitotenv.2020.139186
M.J. Benotti, L.A Fernandez, G.F. Peaslee, G.S. Douglas, A.D. Uhler, S. Emsbo-Mattingly A forensic approach for distinguishing PFAS materials. 2020, Environ. Forensics, 21 (3-4) (2020) 319–333. https://doi.org/10.1080/15275922.2020.1771631
W. Dolbier, Guide to fluorine NMR for organic chemists, John Wiley & Sons, Hoboken, New Jersey, 2016. https://doi.org/10.1002/9781118831106
Products Mentioned
Author